Debugging and Reversing ALPC
Contents:
- Introduction & Disclaimer
- Environment Preparation
- Getting Off The Ground
- From User to Kernel Land
- Hunting An ALPC Object
Introduction & Disclaimer
This post is an addendum to my journey to discover and verify the internals of ALPC, which I’ve documented in Offensive Windows IPC Internals 3: ALPC. While preparing this blog I figured a second post, explaining the debugging steps I took to verify and discover ALPC behaviour, could be useful to all of us that are beginners in the field of reverse engineering and/or debugging.
While I’ve certainly used the techniques and methods shown in this post below, these where not my only resources and tools to dive into ALPC. Even implying this would undermine the important and major work of other researchers that have documented and reversed ALPC internals in the past, like Alex Ionescu and many others. Hence this disclaimer.
TL;DR: The techniques below are practical and useful, but I was only able to apply them due to the work of others.
Another important disclaimer is: I am - by no means - an experienced reverse engineer and this blog post is not meant to be an introduction into ‘how to become a reverse engineer’ or show a smart way to get in this field. This is a ‘use Windows debugging to stumble into a topic and make your way to look around’ post.
Environment Preparation
In order to follow the steps shown below you want to set up a kernel debugging environment. If you already have a kernel debugging environment set up, feel free to skip to section Getting Off The Ground. If you don’t, you’ve got two basic choices for this setup:
- Local live kernel debugging
- Remote kernel debugging
Although the local kernel debugging option only requires a single test machine (virtual VM) and only a single command and a reboot to set you up, I nevertheless recommend starting two machines (VMs) and set up for remote debugging. The reason for this is that local live kernel debugging comes with some constrains and you can’t use the full debugging feature set and can’t go all routes. I’ll nevertheless include the steps to set up local kernel debugging as well, in case you only have a single machine at hand in your test environment.
Setup local kernel debugging
The following steps needs to be done:
- Start up your testing machine or VM
- If you do not already have WinDbg installed, download and install the WindowsSDK from here to install WinDbg.
Alternatively you can also use the WinDbg Preview from the Windows Store App. - Open up PowerShell with administrative privileges and run the following command to enable local kernel debugging:
PS:> bcdedit /debug on & bcdedit /dbgsettings local - Reboot your machine
- Open up WinDbg and enter local kernel debugging mode by running the following command:
.\windbg.exe -kl
Alternatively you can also open up the WinDbg GUI, click File » Kernel Debug (Ctrl+K) » Local (Tab) » Ok
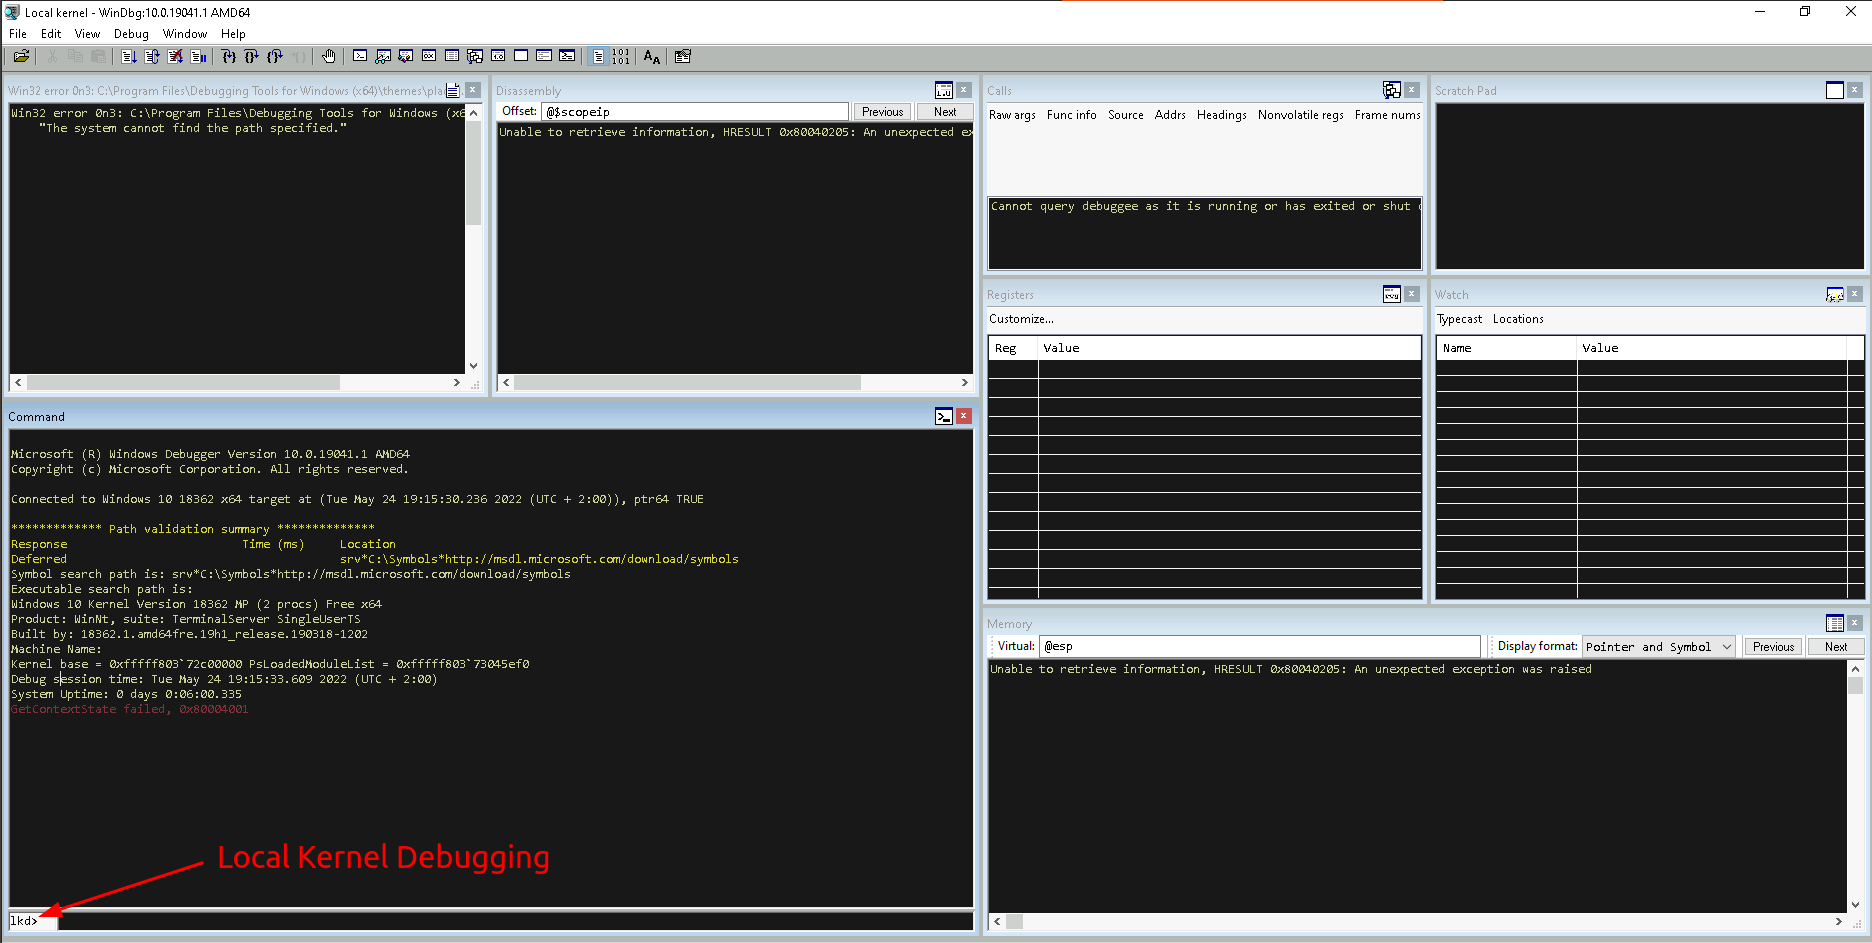
A note about the customized layout shown above
In my case I like to have my debugging windows positioned and aligned in a certain way (and also have the colors mimic a dark theme). You can do all of that by starting WinDbg, open up and position all Windows the way you like them, change the coloring (if you want) under View » Options » Colors and finally save all your Workspace setup via File » Save Workspace to File. Once done, you can open up your local kernel debugging WinDbg with your customized Workspace as follows: .\windbg.exe -WF <Path-To-File>.WEW -kl
All WinDbg command line switches can be found here
Setup remote kernel debugging
- Start your first testing machine or VM that you want to debug, this will be referred to as debuggee machine.
- If you do not already have kdnet.exe installed, download and install the WindowsSDK from here to install it.
- Open up PowerShell with administrative privileges and run the following command:
cd "C:\\Program Files (x86)\\Windows Kits\\10\\Debuggers\\x64\\\" && .\kdnet.exe <DEBUGER-IP> <RandomHighPortNumber>'
I usually use *51111 as port number. This command will give you command line instructions to use from your debugger, see step 6.* - Start your second testing machine or VM that you want to use to debug your first VM, this will be referred to as debugger machine.
- If you do not already have WinDbg installed, download and install the WindowsSDK from here to install it.
Alternatively you can also use the WinDbg Preview from the Windows Store App. - Run the following command to start WinDbg and attach it to your debuggee machine:
cd "C:\\Program Files (x86)\\Windows Kits\\10\\Debuggers\\x64\\" && .\windbg.exe -k <PASTE-OUTPUT-FROM-kdnet.exe-FROM-YOUR-DEBUGGEE>.
The command to paste from kdnet.exe (Step 3.), will look something like this:net:port=<YOUR-RANDOM-PORT>,key=....
You will see a prompt indicating that the debugger is set up and is waiting to be connected. - Reboot the debuggee machine. Switch back to your debugger machine, which will connect during the boot process of your debuggee.
You may have noted that I’ve mentioned the WinDbg Preview store app as an alternative to the classic WinDbg debugger. This preview version is a facelift version of the classic debugger and comes with quite a different UI experience (including a built-in dark-theme). If you’re looking at a one-time setup and are not emotionally attached to the old/classic WinDbg I encourage you to try the WinDbg Preview. The only reason I’m not using it yet is due to the fact that you can’t export your Workspace setup (window layout), which is a crucial feature for me in my lab (which i rebuild frequently).
As a result of that I will be using classic WinDbg in the below
Setting up symbols
Once you’ve setup WinDbg the last preparation step you’ll need to take is to setup your debugger to pull debugging symbols form Microsoft’s official symbol server.
Run the following set of commands within WinDbg to set up symbols:
- Within WinDbg run
.sympathto show your current symbol path configuration.
If it looks similar to the below, which specifies that you want your symbols to be loaded from Microsoft’s symbol server and cache those in C:\Symbols, you’re good to go…
- If your output does not look like this and you simply want to pull all your symbols from Microsoft’s official symbol server, run the following command within WinDbg:
.sympath srv*https://msdl.microsoft.com/download/symbols
More about symbol servers, caching and the how & why can be found in Microsoft’s documentation page here.
Getting Off The Ground
Let’s say we know nothing at all about ALPC and want to start digging and understanding how ALPC works under the hood. As ALPC is undocumented we cannot start our journey by sticking our head into Microsoft’s rich documentation catalogues, but instead we have to a apply a methodology that is based on a loop of reversing, making assumptions, testing assumptions and verification/falsification of assumptions to finally build our picture of ALPC.
Alright, if we do not know anything about a technology beside its name (ALPC), we can firing up our WinDbg kernel debugger and start to get some information about it by resolving function calls that contain the name “ALPC” - this might not be the smartest starting point, but that doesn’t matter, we start somewhere and make our way…
The WinDbg command we need for this is: kd:> x *!*Alpc*
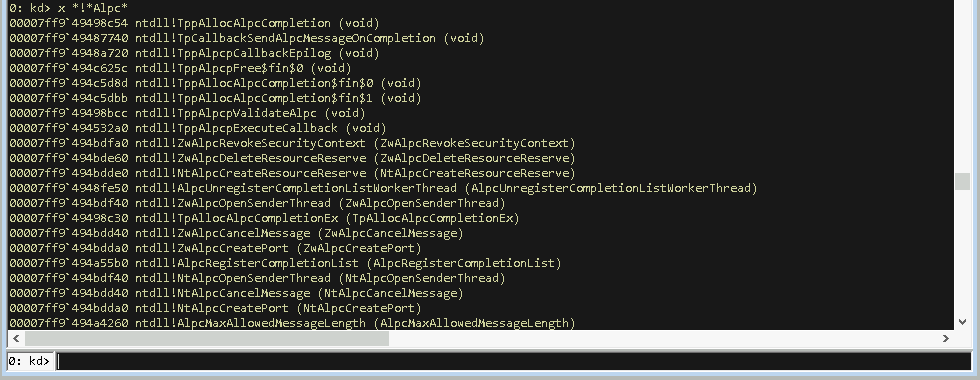
This command will resolve function names of the following pattern [ModuleName]![FunctionName], where we can use wildcards (‘*’) for both the module and function names. In this case that means we’re resolving all functions that contain the word “Alpc” in their names within all loaded modules.
In case it’s your first time with WinDbg (or you’re like me and tend to forget what certain commands mean), you can always use WinDbg’s help menu to lookup a command via: kd:> .hh [Command], as shown below:
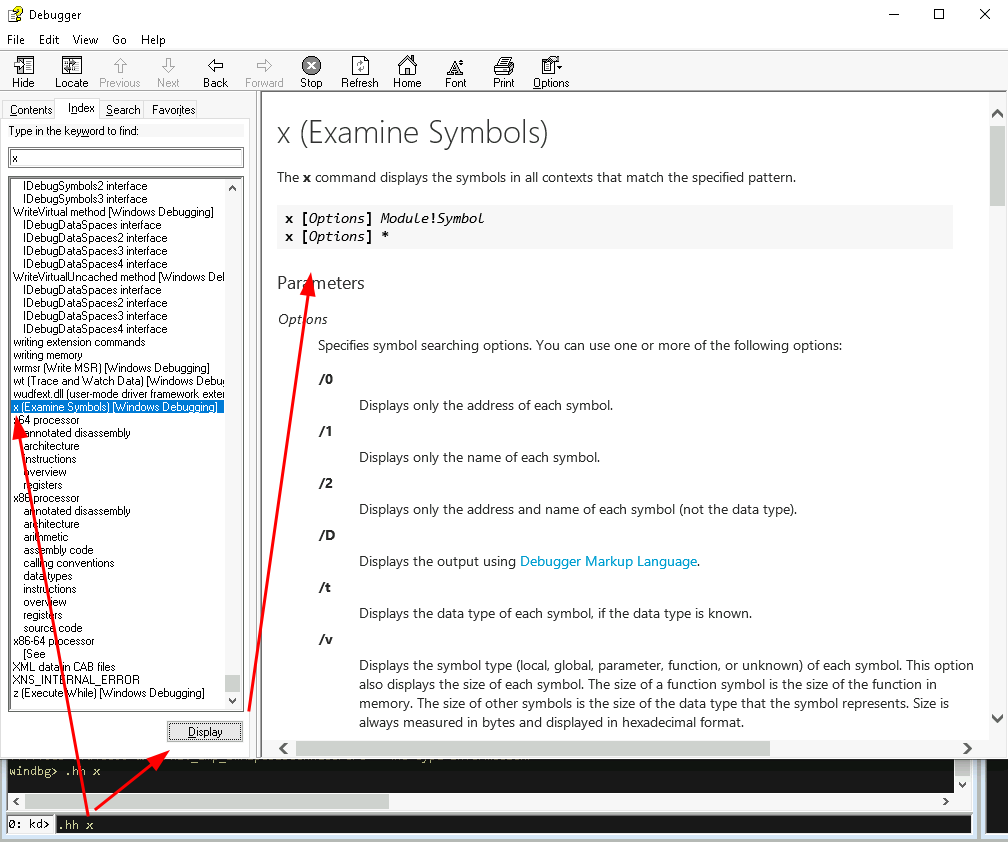
Side note: Although the command you’ve entered is pre-selected you actually have to click the ‘Display’ button. Another option is to lookup the Debugger commands online here.
If you get an error saying that that something could not be resolved, you likely do not have your symbol path set up. Ensure you have your symbols either stored locally or pulling from https://msdl.microsoft.com/download/symbols (or both). You can check your sympath with: .sympath

If you have your symbol path setup correctly, you’ll receive a good amount of results showing all sorts of functions that contain the name “ALPC”. If things take too long (because you made a typo, or things can’t be resolved or any other problem occurs) you can always hit <CTRL>+<Break> or open the Debug menu and click Break to stop the current action:
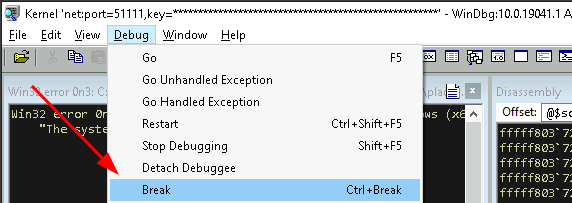
From here you should copy all the resolved functions into an editor of your choice (I use VisualStudio Code) and sort these by name to get a feeling for which Alpc functions exists in which modules and may belong to which components. The strong naming convention applied to the Windows codebase will help you a lot here, so let’s have a look at this:
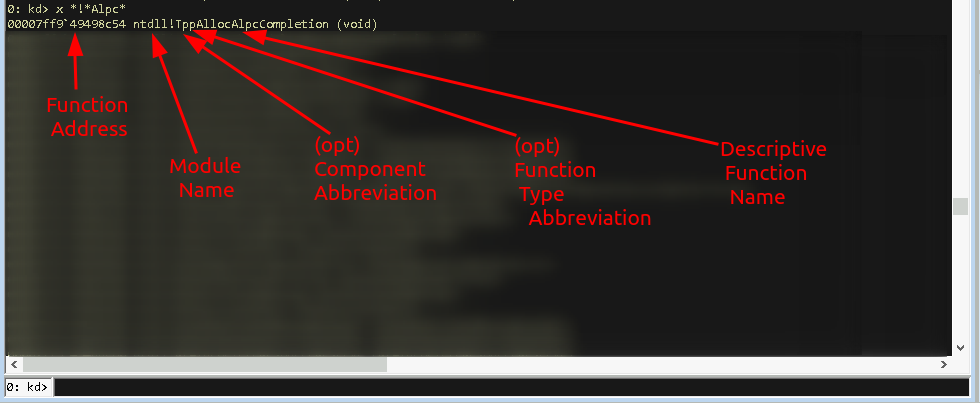
To make this more readable:
00007ff9`49498c54       >> The function address
ntdll                   >> The module name ("ntddl" in this case)
!                       >> The seperator
Tp                      >> Abbreviation of the component ("Thread Pool" in this case)
p                       >> Abbreviation of the function type ("private")
AllocAlpcCompletion     >> Descriptive name of the functions
Looking only at this very first resolved function call we can make the assumption that this function is a private function within the ThreadPool component within ntdll.dll, which likely does some allocation of some memory for something.
Applying this knowledge to all listed functions, we can sort and organize the resolved functions to create a rough picture of where (in the codebase) these are implemented:
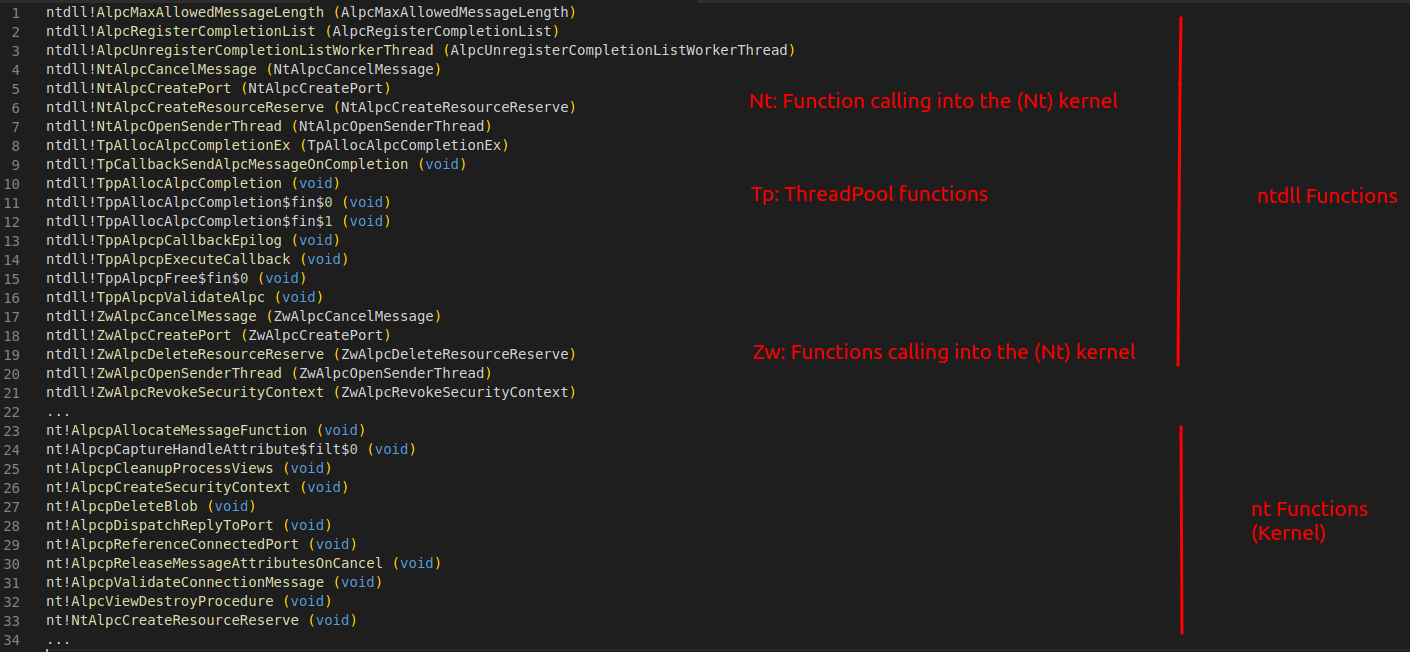
The value of this step is not being a 100 percent accurate or getting a label assigned to each function, but instead create a rough mapping of which parts of the OS are concerned with ALPC and which of these modules and function names sound familiar and which don’t.
From here on we can drill down into modules that sound familiar (or interesting) to us. For example we have spotted the ntdll module, which we know is the userland border gateway for calling native system (kernel) services (functions). So we can assume that Windows allows userland processes to call certain ALPC functions, which comes down the the assumption of “ALPC is usable from userland applications”.
Looking only at “*Alpc*” functions inside the ntdll module we can find that there are 4 types of functions:
- No-component functions, e.g.:
ntdll!AlpcRegisterCompletionList - Nt-component functions, e.g.:
ntdll!NtAlpcCreateResourceReserve - Zw-component functions, e.g.:
ntdll!ZwAlpcCreateResourceReserve - Tp-Component functiosn, e.g.:
ntdll!TppAllocAlpcCompletion
As the Nt and Zw functions are meant to call the same kernel functions (see here, here and here for why they exist), we can safely ignore one them, so we’ll cut off the Zw functions. I myself am not too familiar with the thread pool manager, so I’ll drop the Tp functions as well, which leaves us with a much smaller set of potentially interesting functions:
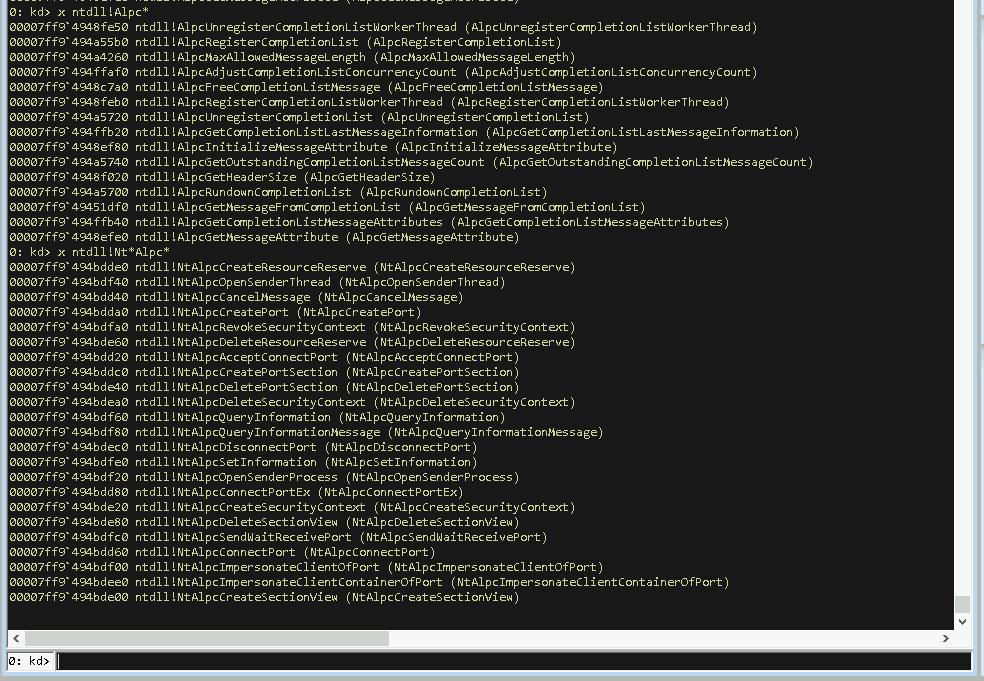
Once again the goal here is not to select a specific set of functions, but instead just making a selection based on something. It’s always a good idea to select things you know or that sound familiar and cycle down a learning path from there…
The upper list of the no-component ALPC functions does have a lot of function names containing the words “CompletionList”, which might or might not sound familiar to you. The bottom list of Nt ALPC functions on the other hand appears quite heterogeny and based on the Nt component naming convention I would assume that these functions are meant to be gateway functions from user-land to kernel-land. We’ve drilled down this far so let’s take one these functions and start the reversing job.
There is no right and wrong in picking one, you can be lucky and pick a function that is meant to be used during the early stage of an ALPC setup, which has further hints on how to use ALPC, or one might unknowingly pick a function that is only meant for special ALPC scenarios… the joy of undocumented stuff…
At this point we can’t know which function is a good starting point, so let’s choose one that at least sounds like its meant to be used at the start of a process, like something with Create in its name:

I obviously already know that this function is going to be useful, so forgive me the “let’s pick something randomly”-dance.
From User to Kernel Land
Let’s fire up Ghidra and have a look at the NtAlpcCreatePort function within ntdll.dll:
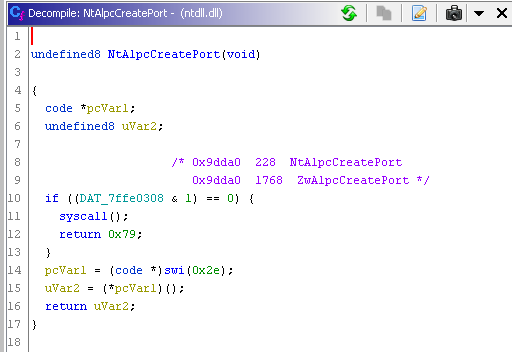
Ok… this is not increadibly helpful… and also looks odd. A syscall is made with no arguments and the function then returns the integer 0x79…
Double checking this decompiled code with the actual instructions displayed right next to the decompiled window, does show a different picture:
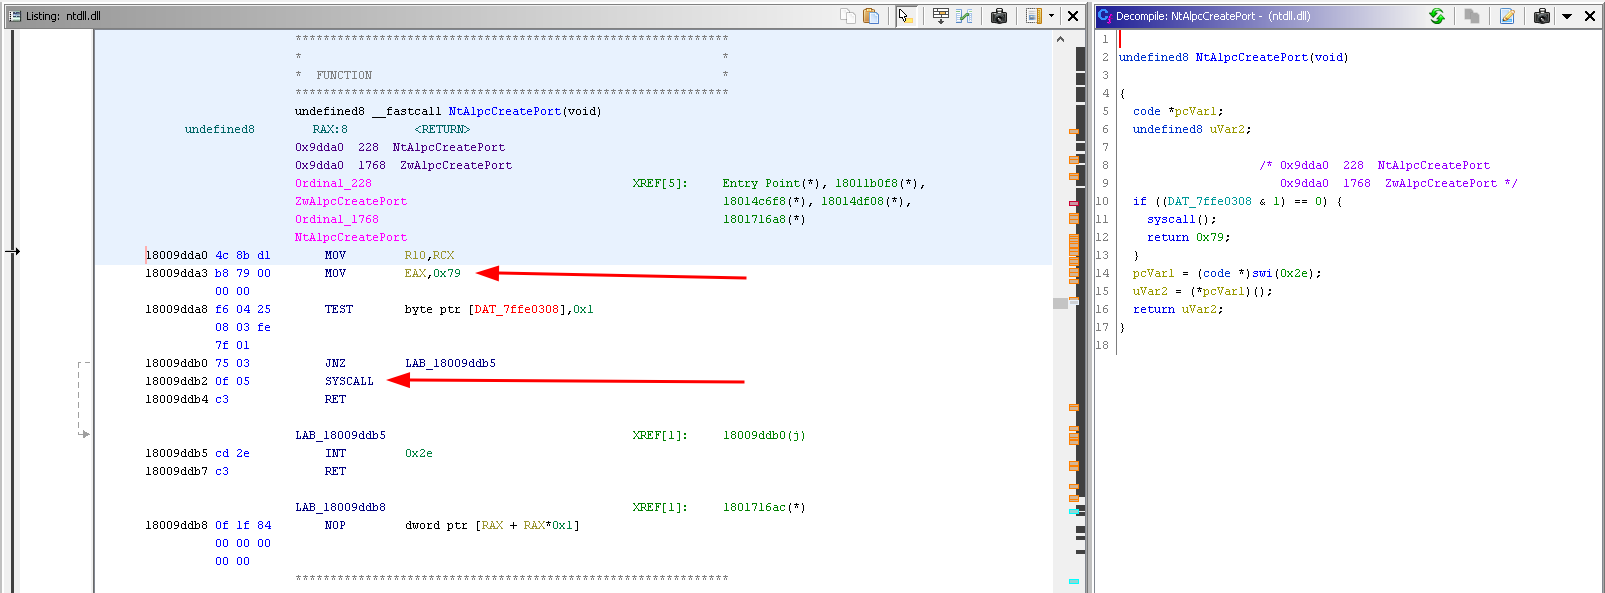
The actual code instructions show that the integer value 0x79 is moved into EAX and then the syscall is made. Quickly double checking this with IDA Free to be sure:
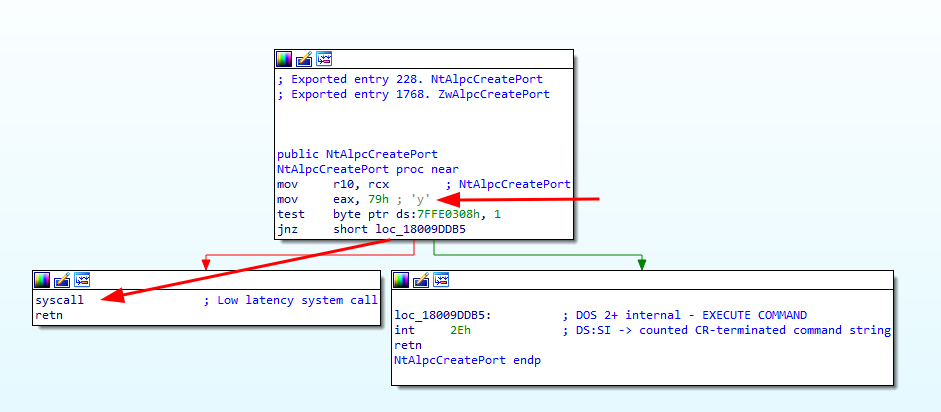
Yep, okay that makes more sense. First take away here is: Ghidra is a really great tool, the decompilation feature can be flaky (even for simple functions), but on the other hand: Automated decompilation is a massive feature that is handed out for free here, so no hard feelings about some errors and manual double checking effort.
We figured the NtAlpcCreatePort function within ntdll.dll is pretty much calling into kernel mode right away using the syscall number 0x79 (121 in decimal).
From here we got three options to continue:
- Head to the kernel straight away and look for a function with a similar name and hope that we get the right one (ntdll and kernel function names are often very similar) - This is the least reliable method.
- Lookup the syscall number (0x79) online to find the corresponding kernel function.
- Manually step through the process of getting and resolving the syscall number on your host system - This is the most reliable method.
Let’s skip lazy option 1 (least reliable) and check out options two and three.
Lookup Syscall number online
One of the best (and most known) resources to lookup syscall numbers is https://j00ru.vexillium.org/syscalls/nt/64/ (x86 syscalls can be found here).
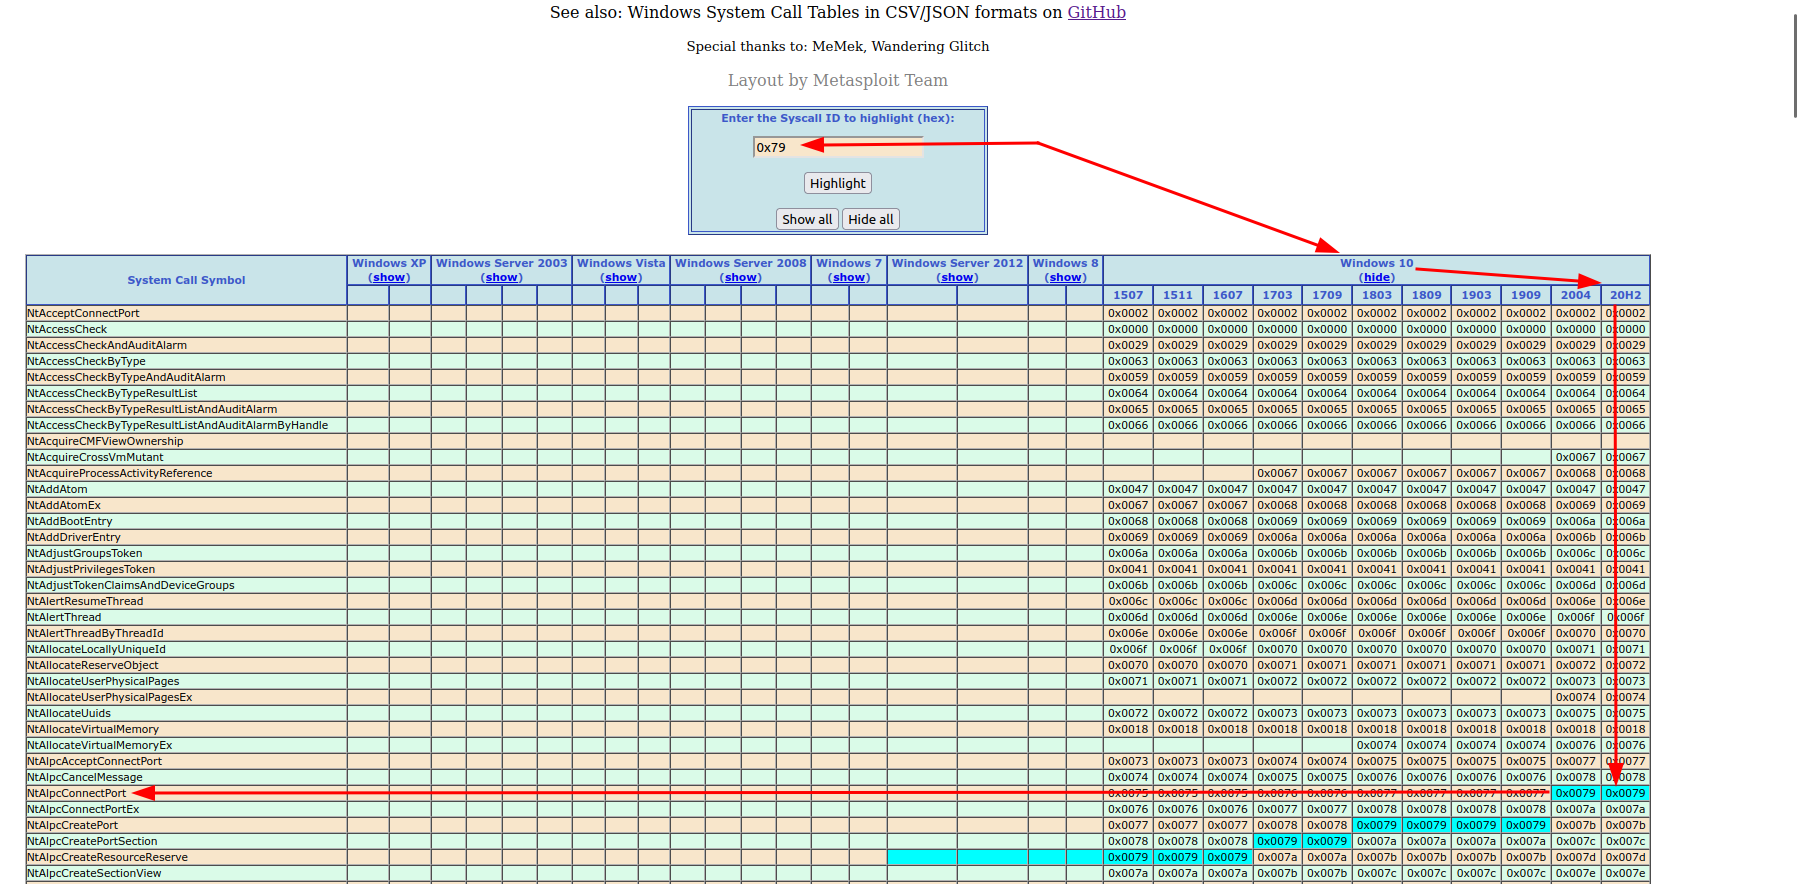
For my Windows 10 20H2 system this great online resource directly points me to a kernel function named “NtAlpcCreatePort”.
Stepping through the syscall manually
I’ve learned and applied the process from www.ired.team, all credits and kudos go to ired.team !
We can use WinDbg to manually extract the corresponding kernel function from our debugged host systems. There are 6 steps involved here:
- Setting a breakpoint in ntdll at
ntdll!NtAlpcCreatePortto jump into the function. This can be done through the following WinDbg command:
kd:> bp ntdll!NtAlpcCreatePort - Verify our breakpoint is set correctly, via:
kd:> bl
- Let the debuggee run until this breakpoint in ntdll is hit:
kd:> g - Ensure we are at the correct location and have the syscall right ahead:
kd:> u .(unassemble the next following instructions)
- Lookup the offset in the SSDT (System Service Descriptor Table) for the syscall number, 0x79:
kd:> dd /c1 kiservicetable+4*0x79 L1 - Checking the address of the syscall function using the SSDT offset:
kd:> u kiservicetable + (02b62100>>>4) L1
All these steps can be found in the screenshot below:
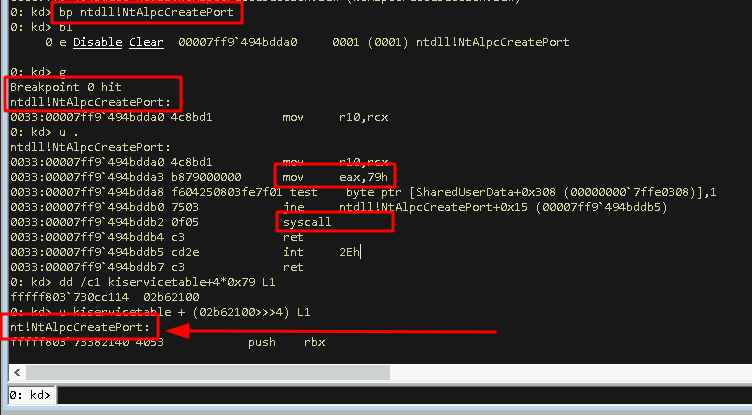
Using either of these three methods we would have come to the result that ntdll!NtAlpcCreatePort calls into the kernel at nt!NtAlpcCreatePort
Hunting An ALPC Object
Now we’ve figured that we end up calling the kernel in nt!NtAlpcCreatePort, so let’s have a look at this.
We can fire up IDA Free (Ghidra would’ve been just as fine), open up ntoskrnl.exe from our system directory, e.g. C:\Windows\System32\ntoskrnl.exe, load Microsoft’s public symbols, and we should be able to find the function call NtAlpcCreatePort. From there on we can browse through the functions that are called to get a first idea of what’s going on under the hood for this call.
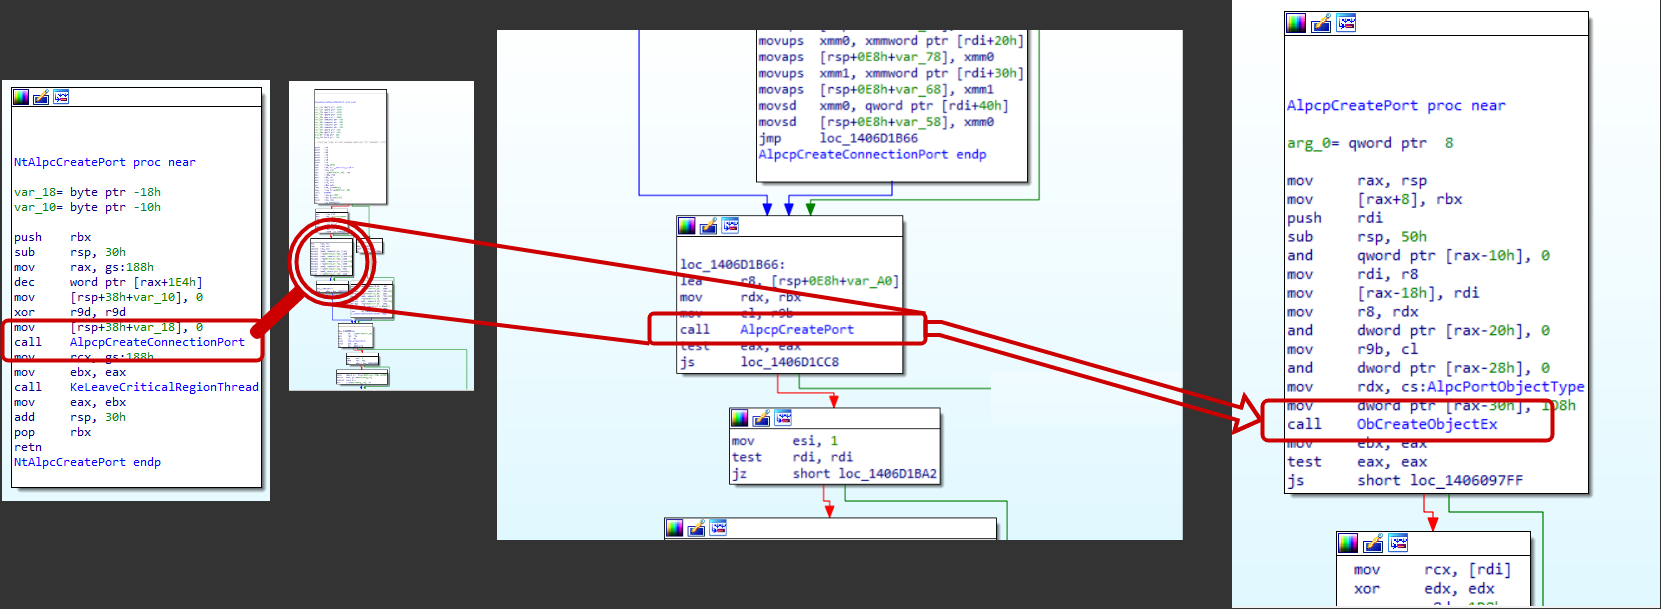
Following the first few function calls will route us to a call to ObCreateObjectEx, which is an ObjectManager (Ob) function call to create a kernel object. That sounds like our ALPC object is created here and IDA also tells us what type of object that is, two lines above the marked call in the window on the right, a AlpcPortObjectType. At this point I’d like to try to get a hold of such an object to get a better understanding and insight of what this actually is. As the function ObCreateObjectEx will create the object the plan here is to switch back to WinDbg and set a breakpoint right after this call to find and inspect the created object.
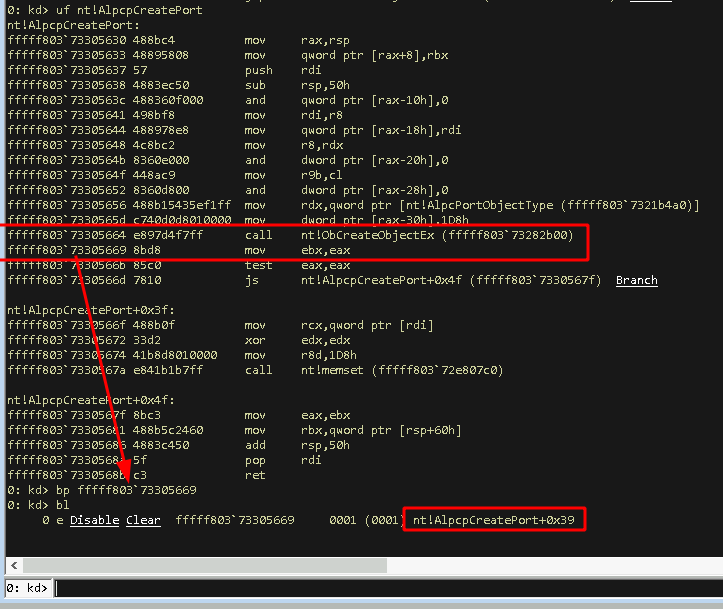
After placing this breakpoint we hit g to let WinDbg run and once it hits we check if we can find the created object being referenced somewhere. The reliable method for this is to follow the object creation process in ObCreateObjectEx and track where the object is stored once the function finishes (the less reliable option is to check the common registers and the stack after the function finishes).
In this case we can find the created ALPC object in the RCX register once we hit our breakpoint.

Sweet we found a newly created ALPC port object. At this point the !object command can tell us the type of the object, the location of its header and its name, but it can’t add additional detail for this object, because it does not now its internal structure. We do not know either, but we could check if there is a matching public structure inside the kernel that we can resolve. We’ll try that with kd:> dt nt!*Alpc*Port…
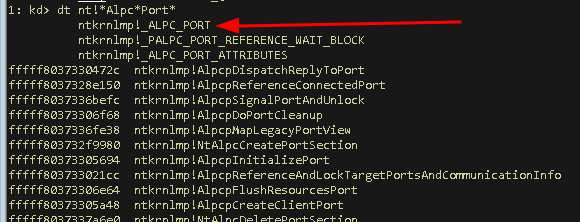
We once again used wildcards combined with the information we obtained so far, which are: We’re looking for a structure inside the kernel module (nt) and we’re looking for a structure that matches an object that we knew is of type AlpcPortObjectType. The naming convention in Windows often names structures with a leading underscore and all capital letters. The first hit ntkrnlmp!_ALPC_PORT looks like a promising match, so let’s stuff our captured ALPC port object in this structure:
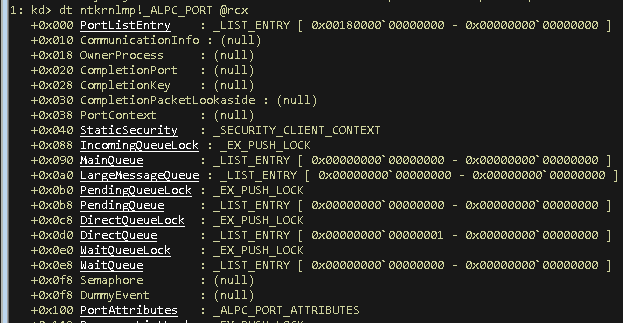
That does indeed look like a match, however some attributes, that one would expect to be set, are empty, for example the “OwnerProcess” attribute. Before we throw our match in the bin, let’s remember we’re still in the breakpoint right after ObCreateObjectEx, so the object has just been created. Walking back through functions we’ve traversed in IDA, we can find that there are a couple more functions to be called within the AlpcpCreateConnectionPort function, such as AlpcpInitializePort, AlpcpValidateAndSetPortAttributes and others. Sounds like there is more to come that we want to catch.
Right now, we’re in some process that created an ALPC port (so far we didn’t even bother to check which process that is) and we want to jump to a code location after all the initialization functions are completed and check what our ALPC port structure looks like then, so here’s a rundown of what we want we want to do:
- We want to note down the address of our ALPC object for later reference.
- We want to find the end of the
AlpcpCreateConnectionPortfunction. - We want to jump to this location within the same process that we currently are in,
- We want to load our noted ALPC object into the
ntkrnlmp!_ALPC_PORTstructure to see what it looks like.
And here’s how to do that…
- Noting down the ALPC object address… Done:
ffffac0e27ab96e0
- Finding the end of
AlpcpCreateConnectionPort… Done jumping to0xfffff803733823c9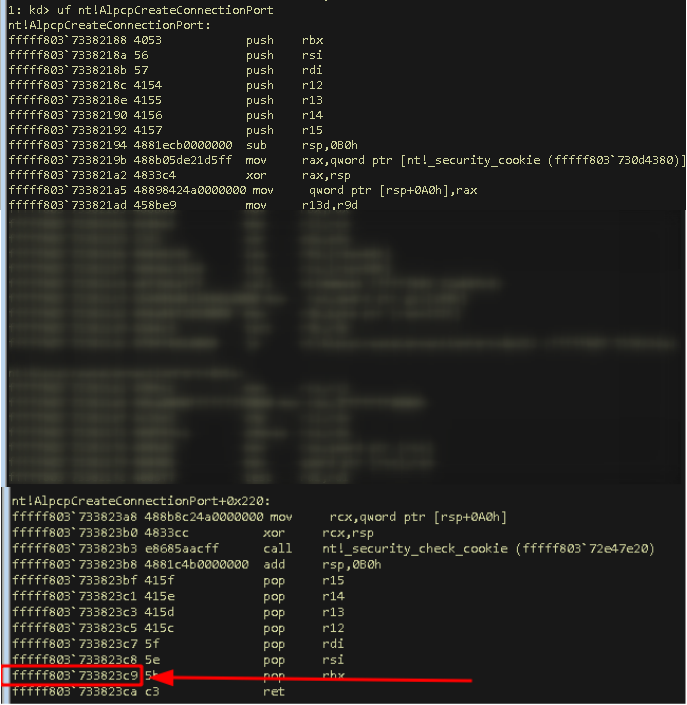
- Jump to this address within the same process can be done using this command
kd:> bp /p @$proc fffff803733823c9
Note: I’m also checking in which process I am before and after the call just to be on the safe side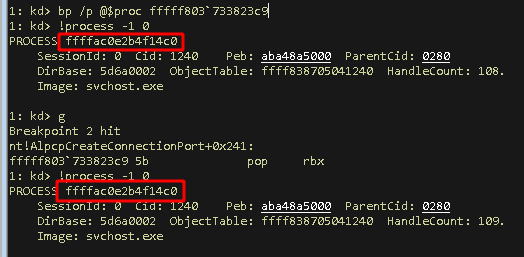
- Check ALPC Objet structure again…
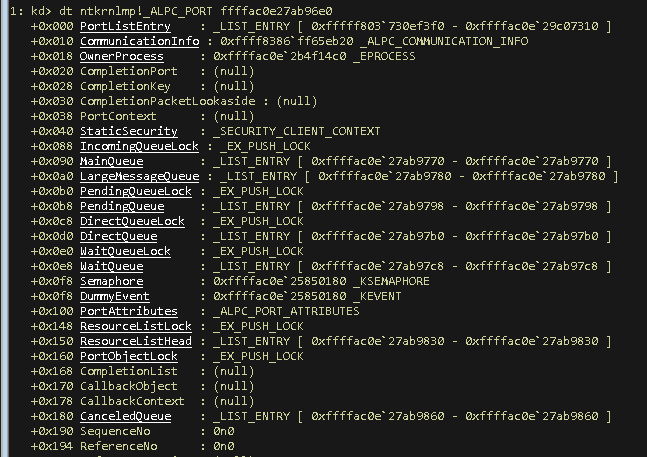
That looks more complete and we could walk through an all setup ALPC object from here as easy as using the links provided by WinDbg to inspect what other structures and references are linked to this object.
Just for the sake of providing an example and to double confirm that this ALPC Port object is indeed owned by the svchost.exe process that we identified above, we can inspect the _EPROCESS structure that is shown at ntkrnlmp!_ALPC_PORT + 0x18:
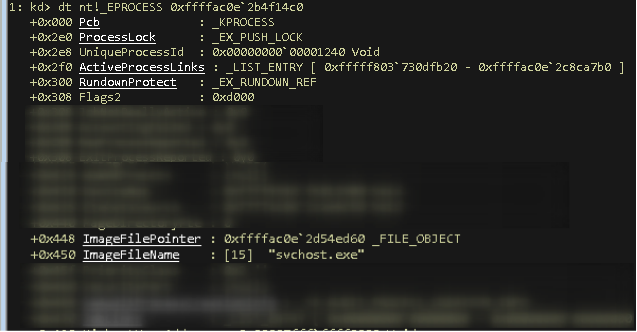
We find the ImageFileName of the owning process of the ALPC object that we’ve caught to be “svchost.exe”, which matches with the process we’re currently in.
At this point we’ve found an all setup ALPC port object that we could further dissect in WinDbg to explore other attributes of this kernel object. I’m not going any deeper here at this point, but if you got hooked on digging deeper feel free to continue the exploration tour.
If you’re following this path, you might want to explore the ALPC port attributes assigned to the port object you found, which are tracked in the nt!_ALPC_PORT_ATTRIBUTES structure at nt!_ALPC_PORT + 0x100 to check the Quality of Service (QOS) attribute assigned to this object (nt!_ALPC_PORT + 0x100 + 0x04).
If you found an ALPC port object with an (QOS) impersonation level above SecurityIdentification, you might have found an interesting target for an impersonation attack, detailed in my previous post Offensive Windows IPC Internals 3: ALPC.
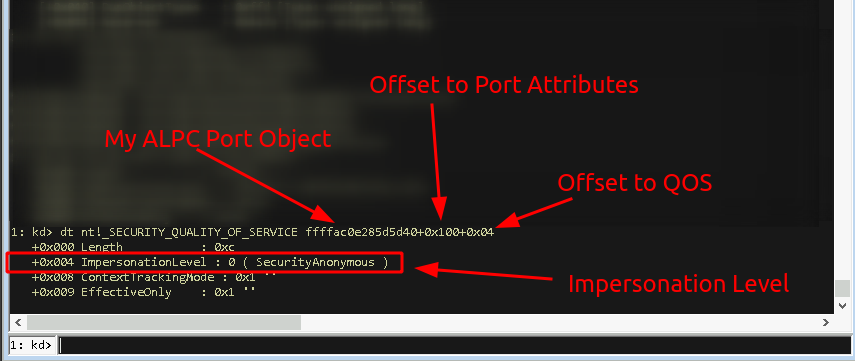
In this case, it’s only SecurityAnonymous, well…

By now you should be all set up to explore and dig into ALPC. The first steps are obviously going to be slow and you (and I) will take a few wrong turns, but that is part of everyone’s learning experience.
If I could add a last note to aid in getting on a joyful ride it’s this: I personally enjoy reading good old, paperback books, to learn, dig deeper and to improve my skillset with Windows internals. If you are of similar kind, you might as well enjoy these book references (if you not already have them on your desk):
- Windows Internals Part 1
- Windows Internals Part 2
- Inside Windows Debugging
- Windows Kernel Programming
There already is a published 1st edition of this, but if you want the latest and greates you might want to wait for @zodiacon’s new release.
… Enjoy your ride ;) …
